
Welcome to A.B.Conomy
Finding helpful economic data can be challenging, so we consolidated it! From the housing market to unemployment rates, we compile research and make sure it’s accessible and easy to understand.
With each chart you’ll find a description of the data and our source. We believe in providing transparent sourcing and clear data at all times.
Database is updated on a monthly cadence. Please keep in mind that data is provided on a 1-month lag (i.e. January data will be available in February).
Navigate using the table of contents here:
Data will be updated monthly. See below if you’d like to read educational articles of varying levels and learn more about finance and economics!
Charts last updated: March 2025
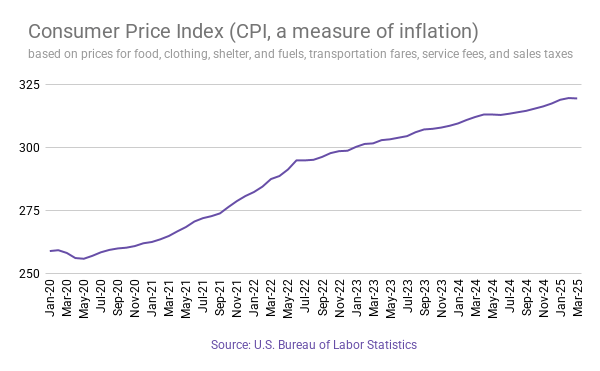
Consumer Price Index
The Consumer Price Index is the current cost of necessary items. These items include prices for food, clothing, shelter, and fuels; transportation fares; service fees (e.g., water and sewer service); and sales taxes.
CPI is a helpful measure of inflation, and it allows us to better understand why/how prices of general goods are increasing.
Prices are collected monthly from ~4,000 households and ~26,000 retail establishments across 87 urban areas.
Source: U.S. Bureau of Labor Statistics
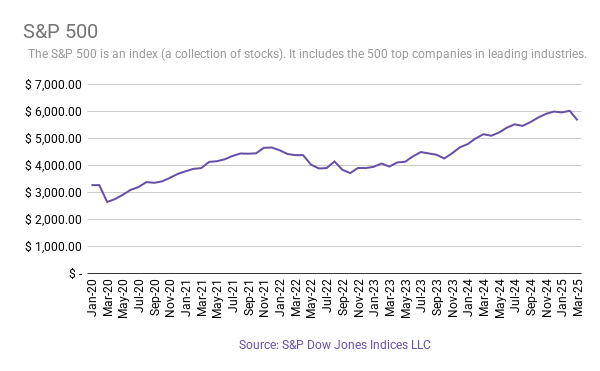
S&P 500
The S&P 500 is an index (group) of the 500 leading companies in leading industries. S&P stands for ‘Standard & Poors’ which is a ratings agency. The S&P 500 price changes daily, but for easy comprehension, we include monthly averages in our chart here.
We can get a good idea of how the stock market is doing by looking at the S&P 500. The S&P 500 is a great reference point, and usually is representative of the stock market as a whole. When the S&P 500 is high, the market is doing well.
Source: S&P Dow Jones Indices LLC, S&P 500
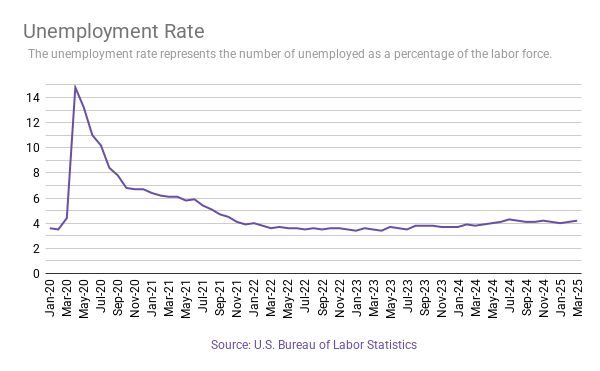
Unemployment
The Unemployment Rate is the percentage of the labor force that is unemployed but wants a job. The labor force consists of people who are 16 years or older, live in the United States, and do not live in a mental health facility or elderly home.
We can get a good idea of how the job market is by looking at the Unemployment rate. When the rate is low, most people that want jobs have jobs. When the rate is high, it is usually a result of economic turmoil (such as the spike in early 2020).
The series data comes from the ‘Current Population Survey (Household Survey)’
Source: U.S. Bureau of Labor Statistics
